The easiest way to visualise your data in real-time
Chirpier is a fully managed service that gives you the power of an analytics team, in seconds. Visualise your data in real-time, and configure monitoring alerts with ease.
Chirpier scales to millions of events a second. No need to build a frontend or manage data pipelines - no data warehouses, no SQL, no NoSQL, no hassle.
Get started for free
Demo chart
Chirpier is a flexible service for monitoring any data stream in real-time. With seamless integration and minimal setup, Chirpier makes it easier than ever for developers to build custom monitoring solutions for any application. Whether you're tracking user behaviour, or application performance, Chirpier gives you the tools to see everything happen, as it happens. Charts update in real-time via web sockets. No constant polling, no page refreshes.
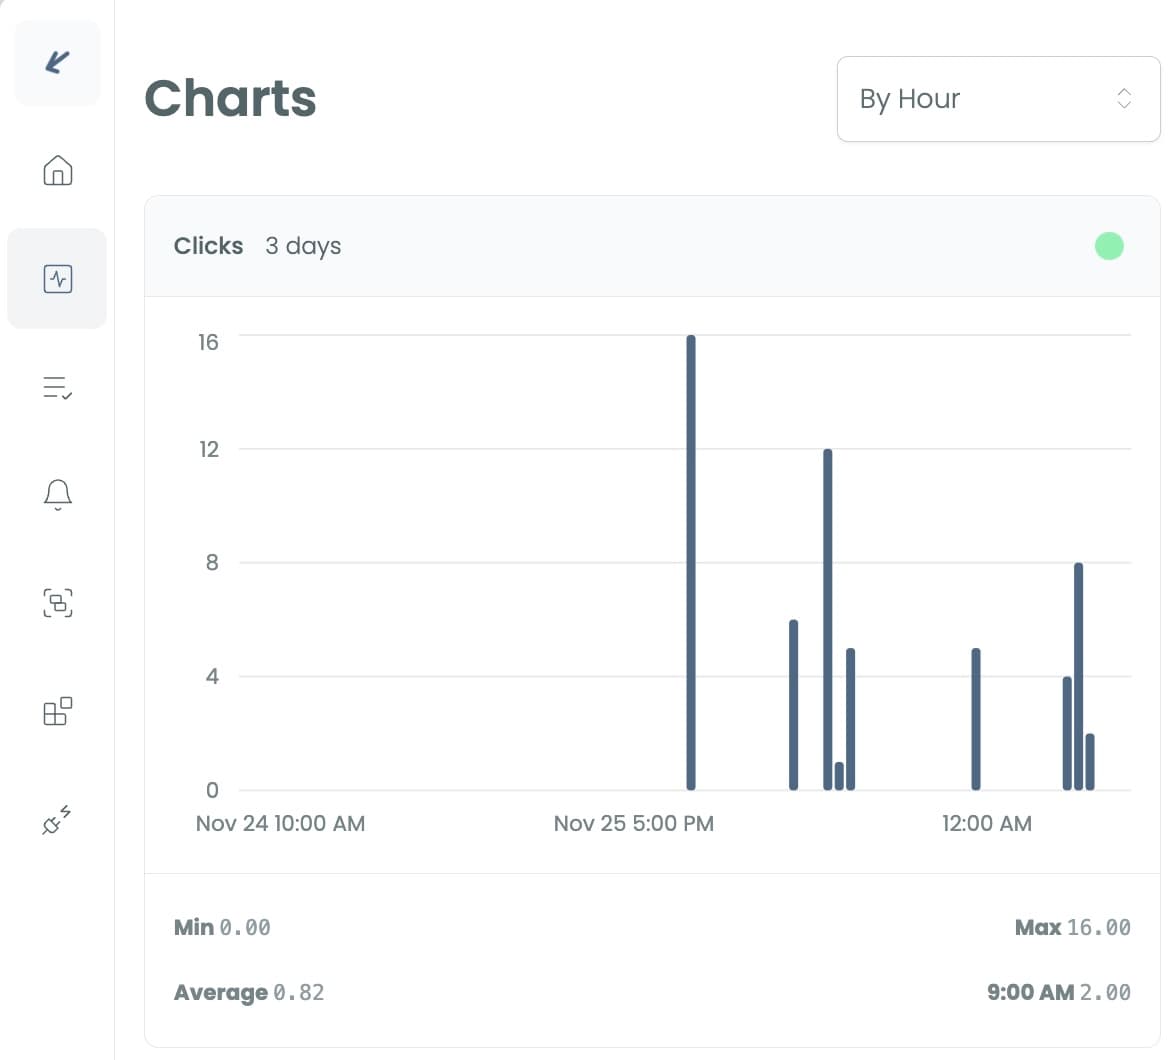
This demo chart shows user clicks on the button below. Click on the chart to explore the configuration options.
Select monitoring time window - events by minute, hour or day:
2 hours
Average
Mar 28 9:59 AM
Click the button - watch as the chart updates automatically.
This button click emits an event using a few lines of the Chirpier JavaScript SDK
Learn more about how to use Chirpier to see your data in a few lines of code in our Docs here. Get started for free.
Embed Chirpier SDK
There are only two steps to visualising your data with Chirpier. First, emit your simple event data object to our API (or use one of our SDKs). Second, navigate to your dashboard. Start monitoring any of your data streams using just a few lines of code.
Step 1
Emit data to the Chirpier service
// Install the Chirpier JavaScript SDK
npm install @chirpier/chirpier-js

// Use the Chirpier JS SDK in your code
import { initialize, monitor, Event } from "@chirpier/chirpier-js";

// Initialize the SDK with your API key
initialize({
  key: "your-api-key",
  region: "us-west",
});

// Send a data stream tied to a group_id
monitor({
  // The unique monitoring group identifier
  group_id: "bfd9299d-817a-452f-bc53-6e154f2281fc",
  // A unique stream name
  stream_name: "My measurement",
  // Example measurement value emitted
  value: 15.30,
} as Event);
Step 2
Start visualising your data immediately
Authenticated dashboard
Log in to your account with Chirpier to view your charts in our authenticated dashboard. Our multi-tenanted architecture means only you and your team will see the data you've sent us with your API key.
Shareable link
Configure your chart to be viewable outside of Chirpier, and set a shared password. Share a public URL with anyone you want.
Real-time data in the simplest way possible
Visualise at pace
What if your teams could see data in real-time, and manage alerts, all without any infrastructure setup? Send us data direct via API or use our SDK, and watch as your charts update in real-time.

Two steps
How simple? Emit your data to Chirpier using one of our SDKs. Then, configure your chart and alerts in our dashboard.
Embedded charts out of the box
Do you want to see average stream values, or the total cumulative over time? Turn your data stream into a customisable visualisation in seconds.


Alerts
Set up alerts to notify you when your stream values, counts, or metrics exceed configured thresholds.
Privacy by design
Our multi-tenant architecture ensures that your data is always private and secure. Our platform only stores data streams and values you send.
